Income inequality in Canada has increased over the past 20 years, mainly due to market forces and institutional forces.
Canada currently ranks 12th out of 17 peer countries on income inequality, as measured by the Gini coefficient. Denmark and Norway have the lowest income inequality among the group and the U.S., in 17th place, has the highest income inequality.
The causes of rising inequality tend to fall into two broad categories: market forces and institutional forces.
Market forces, particularly skill-biased technical change and increased globalization, are increasing demand for highly skilled labour. As Edward Lazear, then-chairman of the U.S. President’s Council of Economic Advisors, noted in a 2006 speech: “In our technologically advanced society, skill has higher value than it does in a less technologically advanced society.” Because developed countries import more low-skills-intensive goods and export more skills-intensive goods, jobs in low-skilled industries are lost in those developed countries. In a recent issue devoted to income inequality, The Economist echoed Lazear’s argument, noting that new technologies have “pushed up demand for the brainy and well-educated” at the same time as “the integration of some 1.5 billion emerging-country workers into the global market economy […] hit the rich world’s less educated folk with unaccustomed competition.”
Not all researchers agree that skill-biased technical change (SBTC) and globalization are at the root of all or even most of the rising inequality. In a paper published in the Journal of Labor Economics, David Card and John DiNardo argue that “contrary to the impression conveyed by most of the recent literature, the SBTC hypothesis falls short as a unicausal explanation.”
An alternative explanation, put forward by economist Paul Krugman and others, is that the increase in inequality can be attributed to institutional forces, like declines in unionization rates, stagnating minimum wage rates, deregulation, and national policies that favour the wealthy. In Canada, Armine Yalnizyan notes that falling top marginal tax rates are part of the explanation for the rise of the richest 1 per cent of the population.
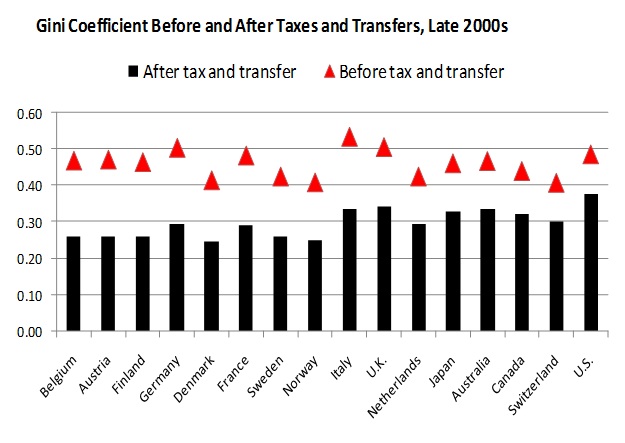
Personal income taxes and government transfers (such as social assistance, unemployment insurance, old age security, and child benefits) do play an important role in reducing income inequality. We can see this by comparing the two Gini coefficients in the following chart. The red triangles show the levels of the Gini coefficients before taxes and transfers for each peer country. So, for example, the most unequal country using this measure is Italy, with a Gini coefficient of 0.53, followed by the U.K. and Germany. The U.S. has the fourth-highest inequality, while Canada has the eleventh-highest inequality.

After income is adjusted by taxes and transfers, the situation changes dramatically for some countries. The level of the Gini coefficients after being adjusted for taxes and transfers are shown by the black bars. The chart ranks the countries from left to right based on the size of the decline in inequality due to the tax and transfer system. Of the 17 peer countries, the tax and transfer system affects inequality in Belgium the most. The Gini coefficient falls from 0.469 before taxes and transfers to 0.259 after taxes and transfers. This represents a 45 per cent drop.
At the opposite end, the U.S. tax and transfer system has the relatively smallest effect on income inequality of the 17 peer countries. The U.S. Gini coefficient falls from 0.486 to 0.370—a 22 per cent decrease. Germany, whose inequality before taxes and transfers is worse than the U.S. (with a German Gini coefficient of 0.504) performs much better than the U.S. after taxes and transfers—Germany’s Gini coefficient falls to 0.295.
Relative to its peers, Canada’s tax and transfer system does reduce inequality but only by 27 per cent—the Canadian Gini coefficient falls from 0.441 to 0.324.
But Canada’s tax and transfer system is not reducing income inequality as much as it did prior to 1994. One explanation for the weaker impact of the tax and transfer system on income inequality in Canada is the restructuring of many programs that help to reduce inequality. For example, there has been erosion in the employment insurance (EI) program. One indicator of EI generosity is the beneficiaries-to-unemployed ratio. Ken Battle, Michael Mendelson, and Sherri Torjman estimate that this ratio fell from 82.9 per cent in 1990 to 47.8 per cent in 2009. This means that a smaller share of unemployed people are getting unemployment benefits. Another possible reason for the reduced effect of the tax and transfer system on income inequality is that welfare incomes are not as high as they were prior to 1994. For example, for a single parent with one child, average welfare income fell from nearly $18,200 in 1994 to just above $17,000 in 2009.
This article is an abbreviated version of a longer article that was previously published on the The Conference Board of Canada website.
