
Over 200 million people worldwide are officially unemployed and looking for work. A much larger number of people, however, has a job, but one that is uncertain, unstable and precarious and does not help them out of poverty. Rising economic growth levels are not necessarily resulting in higher wages for them, or higher employment rates. Therefore, the challenge is not only to create enough jobs for the growing world population, but also to create better jobs with a decent wage.
In the past six decades the number of jobs has risen worldwide from 900 million in 1950 to 3.1 billion in 2007. This image was recently distorted by the economic crisis that started in 2008, which resulted in a global job loss of 50.4 million alone in 2009, 1 and 67 million fewer employed people around the world in 2012 than expected following pre-crisis trends. 2 However, since the Second World War, humanity has done surprisingly well in generating employment opportunities to meet the needs of a rapidly expanding population and the increasing participation of women in the labour market. Higher economic growth rates that grew ten-fold in the last decades were also important factors for employment. 3 Yet this factor alone does not tell the whole story on employment. Work trends are related to many other factors, of which population growth is an important one. They furthermore depend on technological advancement, urbanization, 4 education and skills of the workforce, trends in sector developments, and trade and investment trends.
In addition, despite the enormous total rise of the number of jobs, the quality of work has not increased at the same rate. Work has become more informal and flexible worldwide. Half of all jobs worldwide are now considered ‘precarious’, and a quarter of all workers worldwide earn US$2.00 a day or less, which will be explained below.
More jobs, more unemployment
Since 1950, the world population has grown by 4.6 billion people and it now totals 7.1 billion. The employment-to-population rate is most commonly used to represent overall employment. The employment figure is the percentage of countries’ working-age population (ages 15 to 64 in most countries) that is employed, including people that have stopped looking for work. For the OECD countries, the employment-to-population rate was 64.2% in the 1970s and had its peak at 66.8% in 2007-2008. It reached 65.1% in 2012. 5 Before the 1970s the rate was much lower at around 56%, particularly because most women had no paid job.
From 1996 to 2007, global population increased by 16%, while total global employment grew with 17%. During this period the world added approximately 400 million more people and about the same amount of jobs and the global employment-to-population ratio (age 15+) remained virtually constant at 63%. What this tells us is that global job creation and global population growth were quite stable relative to one another. However, talking in absolute terms, unemployment has risen as well. In spite of the remarkable expansion of employment opportunities in recent decades, 202 million people globally were classified as unemployed by the International Labour Organization (ILO) in 2013. 6
Of this number, 74.5 million are young people aged 15 to 24 years old, and are unemployed and looking for work. The youth unemployment rate is 13.1%, double the official global unemployment rate. 7 But the World Bank estimates that the number of young people without a job is actually much higher at around 300 million people. 8 The ILO attributes the current youth employment problems partly to the economic crisis, but Pablo Christian Aparicio, Professor of Educational Sciences at the Eberhard-Karls University in Tübingen, Germany, argues that besides economic aspects, the more structural social constellation also contributes. For example, the place of residence, sex, ethnic and cultural belonging, and the education levels of the parents, greatly influence the chances of youth getting a job. 9
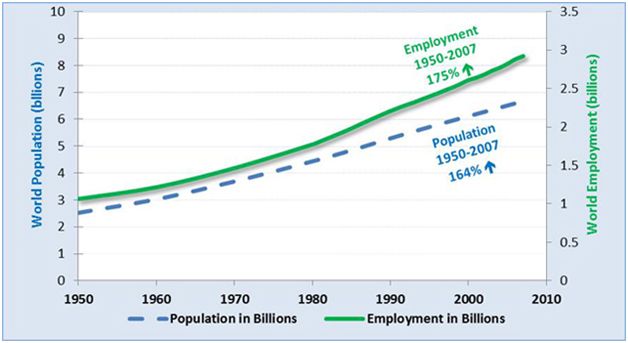
Figure 1. Growth of Global Population and Employment 1950 to 2007. Source: Šlaus, I. and Jacobs, G. (2011b) ‘Human Capital and Sustainability’, Sustainability Journal, 3 (1) [10]
At this point a word of warning is in order (see also box 1). Though aggregate numbers are useful to identify global trends and to compare situations – between countries, regions, age groups, sexes, etc. – aggregate numbers regarding employment must also be used and interpreted with caution. This is because social and economic situations between regions of the world and between societies can differ greatly, and measuring and defining unemployment is a complex task.
Box 1. Reliability of employment statistics
Employment data have to be used with caution. Data can be influenced by definitions, methods of data collection, differences in years of the data and unreliability of data.
Jobs cannot be characterized by a single term or really measured by a single indicator. Unemployment rates are added differently based on local circumstances. Each region in the world uses different age ranges for the ‘working age population’. For example, the World Bank, UN and OECD use the age range of 15 to 64 for the working age population, while many researchers or institutes use the age range of 20 to 65 years. To a certain extent, aggregate numbers, percentages and rates regarding employment compare apples with oranges. There is, fortunately, one definition of unemployment that is often used (e.g. ILO, OECD). According to this definition, adopted in 1982 by the 13th International Conference of Labour Statisticians in Geneva, “the “unemployed” comprise all persons above a specified age who are: (a) ‘without work’, i.e. were not in paid employment or self-employment; (b) ‘currently available for work’, i.e. were available for paid employment or self-employment during the reference period; and (c) ‘seeking work’, i.e. had taken specific steps in a specified reference period to seek paid employment or self-employment’ (ILO 1996-2010).”
Employment data have to be used with caution. Data can be influenced by definitions, methods of data collection, differences in years of the data and unreliability of data. Jobs cannot be characterized by a single term or really measured by a single indicator. Unemployment rates are added differently based on local circumstances. Each region in the world uses different age ranges for the ‘working age population’. For example, the World Bank, UN and OECD use the age range of 15 to 64 for the working age population, while many researchers or institutes use the age range of 20 to 65 years. To a certain extent, aggregate numbers, percentages and rates regarding employment compare apples with oranges. There is, fortunately, one definition of unemployment that is often used (e.g. ILO, OECD). According to this definition, adopted in 1982 by the 13th International Conference of Labour Statisticians in Geneva, “the “unemployed” comprise all persons above a specified age who are: (a) ‘without work’, i.e. were not in paid employment or self-employment; (b) ‘currently available for work’, i.e. were available for paid employment or self-employment during the reference period; and (c) ‘seeking work’, i.e. had taken specific steps in a specified reference period to seek paid employment or self-employment’ (ILO 1996-2010).” An example of a particular way of establishing unemployment numbers is China. Official data on unemployment say that 4.1% of the Chinese labour force is unemployed. Yet, these statistics are only based on urban workers registered as unemployed. Migrant workers from the countryside are excluded from these numbers. It is therefore likely, as the China Labour Bulletin argues that real unemployment rates are twice as high as the official ones. Unemployment statistics are also affected by the fact that globally many people are so discouraged by their lack of opportunities that they have stopped looking for work and do not appear in official unemployment statistics anymore (UNDG 2013, p.12). Also, underemployed part-time workers who want to work more and persons seeking work but not available within two weeks, are also often not calculated in the official unemployment numbers. In the US, for example, the recent fall in unemployment was more likely caused by a decrease in the share of people actively looking for work, as Paul Krugman writes, rather than to rising employment. In addition, in developing regions, especially in sub-Saharan Africa, employment data are scarce and unreliable, as censuses are infrequent. Also, there is a lack of reliable data on informal employment in those regions, as the number of people in informal and vulnerable work is difficult to measure. As a result of all those challenges in data definition and collection, reliable data covering the whole world are lacking and comparisons between data are problematic. This article therefore draws largely on global and regional data that do exist and have been made comparable by the ILO, UN, World Bank and OECD. These data are based on population censuses, household surveys, and national statistical bureaus and have been adapted to make them comparable.More
– United Nations Development Group (2013) ‘Growth and Employment in the Post-2015 Agenda: Messages from a global consultation.’ UNDG The World We Want, New York.
GDP growth and employment
Although GDP growth contributed to the increase of job creation, economic growth does not automatically lead to more jobs, nor does it guarantee better paying jobs. For example, despite impressive economic growth rates in emerging markets like China, with a GDP growth on average of about 10% a year since 1978, and Brazil with around 5% growth yearly since 2004, and India with several peaks of 10% yearly since the 1980s; 11 many people in these countries still face unemployment or have to work under poor conditions in the informal sector. 12 Most of the employment creation in emerging economies has not resulted in formal jobs that provide access to employment rights and benefits and social security, as Sandrine Cazes and Sher Verick show in their 2013 book, The Labour Markets of Emerging Economies: Has Growth Translated into More and Better Jobs? 13
For example, China expected to increase jobs through economic growth. Yet, the amount of jobs actually created (even -2.5% in some regions in 2012), did not increase at the same pace as the GDP growth (7.8% in 2012).jj If growth and work were indeed so correlated, the actual number of jobs created in China would be the result of a much lower growth, namely 2%. The same disappointing ratios of employment creation to GDP growth can be seen around the world in both the developed and less developed world, for example in Thailand (figure 2 in box 2.), South Africa, Turkey, 15 the UK, and France (figure 3 in box 2.). Even in Africa, a continent with high GDP growth rates in many countries, the male employment ratio did not significantly increase between 1991 and 2010 (figure 4 in box 2.). Take for example emerging Kenya where the ratio decreased from 72% in 1991 to 64% in 2010.
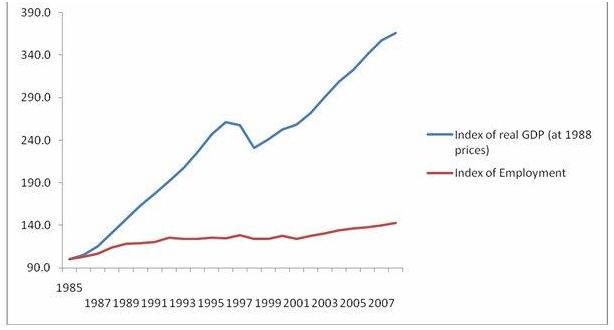
Figure 2. GDP and Employment in Thailand. Source: Chandrasekhar, C.P. and Ghosh, J. (2010) ‘Economic background to political crisis.’ Monthly Review.
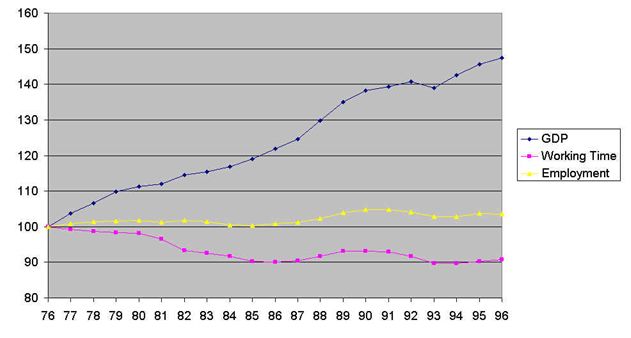
Figure 3. GDP, Working Time and Employment in France. Source: Pianta, M. and Vivarelli, M. (1996) ‘Unemployment, Structural Change and Globalization.’ ILO.
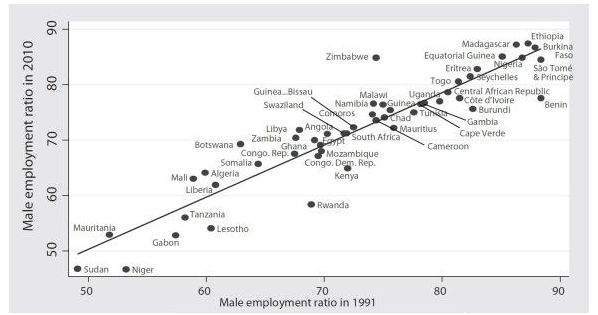
Figure 4. Male Employment Ratios between 1991 and 2010 in African Countries. Source: ILO database (2012), in: Kariobangi (2013) Africa is rising. Employment is not.
Hence, emerging economies like China, Indonesia, and Thailand, which have heavily focused on exports in the last decades to generate economic growth, are now trying to develop their domestic markets by changing their economic strategies. They are doing so by shifting from exports to increasing production for domestic consumption. They, like other countries in the region, are aiming to create more jobs in the next decades, but face challenges from rising population rates and advancing technology that replaces people.
Besides changes in employment, the world is also witnessing fundamental changes in the types of jobs available. This is due to technological change that affects labour productivity and international trade. Through technological change, food production, for example, could increase to feed the growing world population with less labour. However, most of the new jobs are in the service sector (figure 5). Nowadays more people work in service than in agriculture, which was traditionally the main employer. The industrial sector remains the smallest, but increasing, provider of jobs. 16 Especially in South Asia, employment in the service sector has been increasing. This region is increasingly competing with the service sector in developed countries. Over the last decades, a growing number of services have been outsourced to South Asia (and other emerging regions), similar to how manufacturing tasks have been outsourced for more than 40 years, particularly to East Asia. 17 Since 2010, China is the biggest manufacturer in the world, ahead of the US. 18 Despite the fact that more people are finding work in the services sector, industry remains the largest sector in China. 19
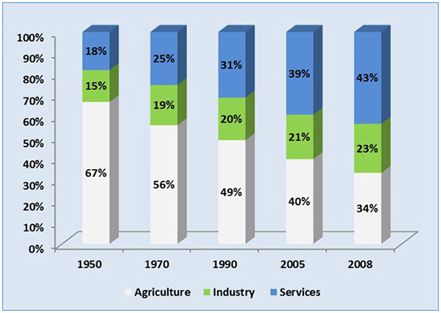
Figure 5. Worldwide Employment by Sector: 1950–2008. Source: Šlaus, I. and Jacobs, G. (2011b) ‘Human Capital and Sustainability’, Sustainability Journal, 3 (1)
Historical perspective
After the Second World War, governments in developed countries strived for full employment, with the aim that all eligible people who wanted to work could find employment at prevailing wage rates. The 1950s and 1960s saw very low rates of unemployment of around 3% on average as a result of the post-war boom and reconstruction work, where many developed countries could benefit. 20 Governments actively stimulated job creation through working schemes and investments in housing and infrastructure. At the same time, since 1950, technology has played an important role in the shift from manual labour to white-collar work in many developed countries. 21 Through investments in education and skills, workers could adopt and benefit from new technology to get better and higher paying jobs. 22 The international trade environment was stable with protection schemes to stimulate factory and service sectors to develop and create jobs for the increasing population. It must be said that the majority of women in this time period were classified in the category of ‘economically inactive’, because the majority stayed home and took care of the household.
The energy crises of 1973 and 1979 resulted in stagflation, with no economic growth and increased prices and unemployment. 23 Full employment schemes were under pressure because of the increasing public debt and rising inflation. The Western focus of governmental policy became more about inflation control, meaning that full employment could not be guaranteed anymore. The economic models show that placing employment above the needs of an economy at such a time would have increased prices even further. From the 1980s onward, the economic model of market thinking regarding deregulation, privatization, and free trade deepened. The idea was that all governmental interventions in the market had the potential to frustrate economic growth. Economic growth (national income) was a way of making markets work more efficiently. And growth would trickle down to the whole population and create jobs (See the article, ‘Revaluing labour’ in this dossier).
Globalization
Before 1980, most of the global employment growth took place in the Western world, but from the 1980s onwards, emerging East Asian countries and other parts of the developing world showed impressive employment growth due to an increase in international trade. Simple service-related tasks generated through computerization (and the fabrication of its components), like production work, could be outsourced and gave countries like China, Vietnam, Mexico, the Philippines and India, the opportunity to create jobs. However, it had a negative impact on the wage levels of the less-skilled workers in developed countries as a result of global competition (See the article, ‘Creating a global labour market’ in this dossier). 24
In the 1990s, the globalization of the financial sector became dominant, which made short-term profit- making one of the main goals for businesses. As a result, profits trickled down less to the workers and more to shareholders, investment banks, hedge funds and other investors (See the article, ‘Profits without labour benefits’ in this dossier). In the 1990s with the combination of optimism over the fall of communism and the rise of new economic powers – first in Asia with China, Thailand, India, Indonesia and Vietnam, and later in countries like Brazil and South Africa – worldwide unemployment began to fall. However, the jobs that were created were not always better jobs, as working conditions in the newly-created export sectors remained poor. Also, in developed countries the number of working poor was on the rise (See the article, ‘Job insecurity as the norm’ in this dossier), standing in sharp contrast to the emerging global rich who are not dependent on wages. Instead, the global rich tend to invest their money in capital worldwide and less in productive sectors where workers depend on the wages for a living.
The economic crisis, especially in developed countries, worsened many of these trends resulting in higher unemployment, lower wages and more insecure jobs. As said, almost 202 million people were unemployed in 2013, up from 177 million in 2000. 25 If we proceed with business as usual, the International Labour Organization (ILO) foresees that global unemployment will reach 215 million by 2018, because the pace at which people will enter the labour market (42.6 million yearly) will go faster than job creation (40 million yearly). For the period after 2018, the United Nations Development Group (UNDG) estimates that 470 million new jobs have to be created globally between 2016 and 2030, and the World Bank and ILO estimate that 600 million additional jobs are needed to obtain full employment. 26
In contrast to the rising unemployment in Western regions where the exception is a rise of the unemployment rate of at least a percentage point in six European countries in the years to come (Greece, Italy, the Netherlands, Poland, Portugal and Spain) (OECD, 2013), most developing regions and especially the emerging markets have higher employment numbers now than before the crisis. Latin America and the Caribbean have even seen a decrease of the general and youth unemployment rates over the last 13 years from 8.6% total unemployment in 2000 down to 6.5% in 2013 (ILO, 2014). A further gradual, yet more moderate, decline in unemployment is prospected until 2018. The Central and Southeastern Europe (non-EU) and Commonwealth of Independent States, with 8.2% unemployment in 2013, also dealt with a lower percentage than in 2000 (when it still was 10.7%). Yet the region has not shown a continuous decrease as the 2013 percentage is the same as it was in 2007, while in the in-between years the percentage temporarily peaked to 9.9% in 2009 (ILO, 2014). Southeast Asia and East Asia have shown impressive employment growth, however, with an extremely high population growth, unemployment remains high. East Asia accounts now for about 20% of the total world’s share of people without a job. This is the second position in unemployment shares globally, with 39.4 million officially unemployed in 2013 (an increase of 8.0 million people since 2007). Yet, in 2013, an estimated 415 million workers held a salaried job in East Asia (ILO, 2014). The region has seen impressive growth with a near doubling employment level in comparison to 1991. The share of wage workers in total employment increased from 18.5% in 1991 to 50.1% in 2013. In this period the region “successfully moved 464.5 million workers out of poverty, an astounding and unprecedented pace of improving household incomes and living standards,” according to the ILO (2014, p.53). The question for the region now is how to retain the trend of increasing employment, if investment and growth levels stabilize. Box 3. Global regional differences in employment trends
No region has an employment growth matching that of South Asia, where employment grew with almost 2% in 2013, about twice the percentage of 2012. Since 2008 this region shows the lowest percentage of unemployed people with a rather stable number of around 4%. Nevertheless, because of very large populations, South Asia represented more than 45% of the world’s new job seekers in 2013. Yet, labour force participation rates (the percentage of the population of working age, actually participating in the workforce) in that region were at 56.1% in 2013. This was amongst the lowest in the world, mainly because of women not participating in the labour force (ILO, 2014). Despite similar trends of rising employment, the Middle East and North Africa have the highest unemployment rates in the world. The rate of 12.2% of unemployed people in 2013 in North Africa is lower than it was in 2000 when it was as high as 13.2%. In this region, however, the decrease stopped in 2011, with rising numbers to 11.8% versus 10.4% the previous year. Besides, nowadays, 27.2% of the youth in the Middle East has no job, and 29.4% in North Africa are unemployed (ILO, 2014). Many workers only find jobs in the informal economy. The regions have a “long-standing and structural” problem of youth unemployment, according to members of the Global Agenda Council on Employment to the World Economic Forum (WEF, 2013). This situation has deteriorated with the political instability in the aftermath of the Arab revolutions. The high levels of unemployment, especially among the youth, political tensions and social instability are expected to increase across the region well into the 2020s. In sub-Saharan Africa, official unemployment rates have remained stable at around 7-8% in the last decades, with some decrease in recent years. From 1991 to 2000 the average official unemployment rate in the region was 8.4%. Between 2000 and 2005, rates decreased to 7.5%. Yet, since then, unemployment has remained rather stable with the percentage for 2013 expected to be 7.6% (ILO, 2014). The McKinsey Global Institute (2012) estimates the situation slightly more pessimistic, and calculates unemployed at 9%. UNDP (2013), in addition, assumes a number of 10% officially unemployed on the whole continent. Despite the fact that the continent shows one of the highest economic growth rates – the rate for the total region was 4.8% in 2013, so not many new jobs have been created. A large portion of this growth has primarily come from natural resource sectors that do not create many new jobs (they employ only 1% of the African workforce). However, according to UNCTAD (2013), the less-developed countries altogether (of which most African countries) have a high labour force participation rate – an average of 75%, compared to 68% in other developing countries – and youth unemployment in this region is also below the global average (ILO, 2014). As The African Economic Outlook clarifies in low-income countries, unemployment is a luxury good that you have to be able to afford. If you cannot afford it you will necessarily find some work to do in order to survive (AfDB, OECD, UNDP, UNECA, 2012). Hence, only a small part of the working-age population has a paid, formal job – estimations of formal employment range from 13.7% (ILO, 2014) to 30% (UNDP, 2013). Where in many developing economies the manufacturing sector has served as an engine of paid employment creation, by and large this has not happened in sub-Saharan Africa, where only less than 10% of workers are estimated to be in the industrial sector. In all other regions, this share is at least 20% and in the case of East Asia it exceeds 30% (ILO, 2014). The absence of formal employment options, lacking social protection mechanisms and limited family support force people into the informal sector. Still 165 million Africans are still working in subsistence agriculture or in informal self-employment (McKinsey Global Institute, 2012). Often this is vulnerable work and agricultural production is becoming a less viable livelihood for the rural poor (UNCTAD, 2013). Nevertheless, the McKinsey Global Institute (2012) projects that by 2020, Africa will create 54 million new jobs, leaving 70 million people without work. But with the rapid growth of the African youth population, there will not be enough jobs for them (AfDB, OECD, UNDP, UNECA, 2012). Sources: AfDB, OECD, UNDP, UNECA (2012) ‘Promoting Youth Employment in Africa.’ African Economic Outlook. Fine, D. et al. (2012) ‘Africa at work: Job creation and inclusive growth.’ McKinsey Global Institute. International Labour Organization (2014) ‘Global Employment Trends 2014. Risk of a jobless recovery?’ ILO Lusigi, A. (2013) ‘Structural Change & Employment in a Globalizing World: Creating Jobs for all?’ UNDP Presentation. OECD (2013) Employment Outlook 2013. OECD publishing. United Nations Conference on Trade and Development (2013) ‘The least developed countries report 2013. Growth with employment for inclusive and sustainable development. Overview.’ UNCTAD. World Economic Forum (2013) ‘Jobs for Growth and Growth for Jobs. Global Agenda Council on Employment.’ WEF.More
Decreasing quality of work
In addition to unprecedented job growth, the last half century has also been a period in which the quality of jobs available worldwide has improved dramatically due to the progressive shift from manual work to mental work, indicated by the falling percentage of the world’s workforce employed in low-wage agricultural jobs, according to the Club of Rome. 27 However, when jobs are scarce (even in times of economic growth) and needs are high, part of the population will accept any job, regardless of the remuneration, working conditions, and the match with their own skills.
Furthermore, the trend all around the world is to have a more flexible workforce, and this is increasingly so in the developed countries. The trend of flexibilization started before the global economic crisis, but has been exacerbated as a consequence of it. The number of people with a part-time contract in developed regions has increased over the last decades. 28 In 1985, around 9% of workers in OECD countries had a part-time job, and this number increased to 12% in 2007. Part-time work is generally higher among elderly, the youth and women. 29 A quarter of employed youth works part-time and often involuntarily. 30
The ILO attributes the trend of more part-time work to “the increase in the number of women in the labour market, but also to attempts to introduce labour market flexibility in reaction to changing work organization within industry and to the growth of the services sector.” 31 Flexibilization of labour is also reflected in the increase of temporary contracts. Currently, more than 10% of employees in OECD countries have a contract of half a year or less. 32 Prevalence is especially high among young people who are entering the labour market; 40.5% of employed youth in 2011 had a temporary contract. 33
For many emerging and developing countries informality is not a new trend. It is estimated that globally, up to 60% of the workforce is in the informal sector. 34 It is hard to know how many people work outside the formal structures and therefore, the estimations for developing and emerging regions range from 10% to 80%. 35 The precariousness of informal jobs is also reflected in data showing that more than 30% of the workforce in developing regions lives in a poor household and another 25% lives in a household just above the international poverty line of US$1.25 a day. 36 Meanwhile, many self-employed workers in the informal sector work more than 48 hours a week. 37 Women, especially in developing countries, participate less on the labour market, although in rural areas in emerging countries their participation is changing. 38 In South Asia and in the Middle East and North Africa, less than 30% of women have a job. 39 And when a woman does have a job, the woman is more likely to have a precarious job than a man.
In addition to this, it can be said that for the 200 million people worldwide who do not have a job and are actively looking for one, 1.5 billion people do have a job, but one that is not formal, stable or secure. They work in farming and small household enterprises, or in casual or seasonal day labour. 40 Even though statistically, more than 3 billion people have a job, half of them thus do not have a decent one. Informalization of labour is certainly not a new trend, nor a trend caused by the global economic crisis (although the crisis may have aggravated it). Rather, it reveals structural problems related to the number of jobs that are available, the match between the skills of job seekers and the skills required for a job, labour market discrimination, and the tendencies of companies to rely on temporary workers. 41
Informal work, vulnerable work, unstable work, flexibilization, precariousness, and working poverty are different concepts that refer to the quality of work. Whereas ‘informal work’ and ‘vulnerable work’ focus on the formality of the job, ‘unstable work’, ‘precarious work’ and ‘flexibilization’ refer to the level of security and stability that the job gives. ‘Working poverty’ explains the impact these kinds of jobs can have on the financial circumstances of a worker and his or her family, or about the kind of jobs that these circumstances urge him to take. Precarious workers often have no job security and face growing socioeconomic vulnerability (Remery, Van Doorne-Huiskes, and Schippers, 2002). Informality can refer to both work in the informal sector and informal work in the formal sector. Originally the term ‘informal sector’ was based on the distinction between wage employment and self-employment. Nowadays informal employment includes “(…) all remunerative work, both self-employed and wage employment, not recognized, regulated, or protected by existing local or regulatory frameworks, as well non-remunerative work undertaken in an income-producing enterprise” (Arnold and Bongiovi, 2012).Box 4. Defining the quality of work
Read more
While many studies have focused on informal work, vulnerability is a more recent concept. It takes into account not only contributing family members and own-account workers, as the concept of informal work does, but also agricultural work. In Western regions, many people these days talk about the flexibilization of the labour market, which leads to less security and stability for the workers. But in fact, this concept uses about the same characteristics as the words that are usually used to describe trends in developing countries, like unstable and precarious work.
Sources:
Arnold, D., and Bongiovi, J. (2012) ‘Precarious, Informalizing, and Flexible Work: Transforming Concepts and Understandings.’ American Behavioral Scientist 57(3): 296.
Remery, C., van Doorne-Huiskes, A., and Schippers, J. (2002) ‘Labour market flexibility in the Netherlands: looking for winners and losers’ Work, employment and society 16 (3): 477-495.
The increasing flexibility has altered many employees’ relation to work. With deregulations and more temporary jobs, workers are increasingly in a situation that is insecure, unpredictable and risky. Precarious work takes place both in the formal and in the informal sector and both in developed and developing countries. Long assumed to be a sign of underdevelopment, the informal sector remains pervasive throughout the world, also in countries that have experienced impressive growth rates. 42 Most precarious work in the developed world is within the formal sector. Of all people in the informal sector, the percentage of people that are self-employed or contribute to family enterprises is decreasing. 43 This decrease is probably due to the decreasing number of people working in agriculture, as we saw above. On the other hand, the percentage of informal workers in the formal sector without a contract or without social protection is increasing.
In insecure and unstable work and in unemployment numbers, certain groups are overrepresented, namely youth, elderly, and women. Although their participation is increasing, women continue to be underrepresented on the labour market. 44 When they have a job, though, it is more often an informal and low-skilled job than among men. 45 On average, women earn 10-30% less than men with the same kind of jobs. 46 According to the World Bank, “the differences [in earnings] are not fully explained by education, experience, or sector of work.” 47
The impact of low-quality jobs and increasing insecurity when one has a job is reflected in the fact that, especially in developing countries, part of the workers are still poor. The number of working poor is falling in line with the decreasing numbers of extremely and moderately poor in the developing world. 48 This decrease is especially visible in East Asia. However, the number of nearly poor workers earning between US$2.00 and US$4.00 a day in the developing world has increased from 15% of the workforce in 1991 to more than a quarter in 2011. 49 The share of working poor (by local standards) has also increased substantially over the last decade in both the United States and the European Union. 50 And especially in developing countries, there are still workers who work ’extremely long working hours’ in the manufacturing industry while still living in poverty (See the article, ‘Job insecurity as the norm’ in this dossier). 51
The challenge is not only to create enough jobs for the growing world population, but also to create better jobs with a decent wage. Therefore, a focus primarily on GDP growth is not enough, since growth does not automatically lead to higher employment rates in emerging countries and developed countries.
Co-readers
Abdoul Mijiyawa, Economist, African Center for Economic Transformation (ACET), Accra, Ghana
Jens Lind, Professor, Department of Sociology and Social Work, University of Aalborg, Denmark
Jan Rieländer, Economist, OECD Development Centre, Paris, France
Footnotes
- International Labour Organization (2009) ‘Global Employment Trends: Update May 2009.’ ILO. Although the highest impact of the crisis is expected in the developed world, an additional 23 million people are expected to become unemployed in the developing world, 12.8 million of whom will be in East Asia (up 1.5 percentage points to 5.8%), 4.9 million in South Asia (up 0.6 points), and 3.7 million in Latin America (1.2 points). ILO estimates also suggest that, with 45 million new entrants to the jobs market annually, 300 million new jobs would need to be created globally during the next five years to return to pre-crisis levels of employment. International Labour Organization (2009) ‘ILO adopts ‘Global Jobs Pact’ aimed at creating jobs, protecting workers and stimulating economic recovery.’ ILO.
- International Labour Organization (2013) ‘Global Employment Trends 2013: Recovering from a second jobs dip.’, Geneva: ILO. Presently, amongst the available data worldwide, more than 3 billion people officially have a job, according to World Bank’s ‘World Development Report 2013: Jobs.’
- Maddison, A. (2001) ‘The World Economy: A Millennial Perspective.’ OECD: Paris.
- “The urban population rose to 29% in 1950 and reached 50% in 2010, progressively intensifying the competition for salaried jobs.” Jacobs, G. and Šlaus, I. (2011a) Global prospects for full employment (pdf). Discussion paper 02/11, The Club of Rome, p7.
- Switzerland and Iceland show historically the highest employment to population rate of around 80% since the 1980s followed by the Scandinavian countries, the Netherlands and New Zealand. The lowest rate can be found in countries like Ireland, Italy, Poland and Greece around 55%. In emerging countries there are different trends. In Brazil the ratio is around 67% in the last 12 years, while for the same period in South Africa the rate is much lower and declining from 44.1% in 2000 to 41.0% in 2012. Source: OECD StatExtracts.
- International Labour Organization (2013) ‘Global Employment Trends 2013: Recovering from a second jobs dip.’ Geneva: ILO.
- Compared to 4.6% unemployment among adults of 25 years and over. Data are preliminary estimates for 2013. International Labour Organization (2014) ‘Global Employment Trends 2014. Risk of a jobless recovery?’ ILO, p.91.
- Vos, C. (2013) ‘Werkloosheid jongeren kan groei economie ondermijnen.’ De Volkskrant. This difference may be explained partly by differing calculation methods and definitions. (See also box 1. on the reliability of unemployment data.)
- Aparicio, P.C. (2010) ‘Jóvenes y el desafío de vivir en contextos de desigualdad y diversidad. Crisis de las oportunidades de participación educativa y laboral en América Latina.’ UNESCO, p.6.
- Data from U.S. Census Bureau (2010) ‘U.S. and World Population Clocks.’ See also ILO (2005) ‘World Employment Report 2004–05 Employment, Productivity and Poverty Reduction.’ Geneva: ILO, p.111. (World employment in 1950 is based on economically active population for age 15+ assuming unemployment averaged 6.4%). See also International Labour Organization (2011) ‘Laborsta EAPEP. Economically Active Population Estimates and Projections 1980–2020.’ILO. (World Employment for 1980-98 is based on economically active population aged 15+ assuming unemployment averaged 6.4% during the period). See also International Labour Office (2010) ‘Global Employment Trends.’ Geneva: ILO, January.
- World Bank (2014), ‘Country overviews: China / India / Brazil.’
- World Factbook (2014) ‘Unemployment rates 2013’. CIA. : China 6.4%/ India 8.8%/ 5.7% Brazil.
- Cazes, S., and Verick, S. (2013) The Labour Markets of Emerging Economies: Has growth translated into more and better jobs? Palgrave Macmillan. See also Chang, G.G. (2013) Jobless Growth in China? Employment Stats Say Recession Has Already Started.’ Forbes. See also Bradsher, K. and Wong, S-L. (2013), ‘Faltering Economy in China Dims Job Prospects for Graduates.’ The New York Times. See also Özlem, O. (2007) Jobless growth in the Central and Eastern European Countries. A country specific panel data analysis for the manufacturing industry (pdf). Department of Economics Working Paper Series, 103. Inst. für Volkswirtschaftstheorie und -politik, WU Vienna University of Economics and Business, Vienna. See also Caballero, Ricardo J. (1998) Jobless growth: Appropriability, Factor Substitution, and Unemployment. Carnegie-Rochester Conference Series on Public Policy, 48: 51–94.
- Ibid. Chang, G.G. (2013). See also World Bank (2014) ‘China country page.’ In 88 cities surveyed by the Human Resources Ministry of China, the number of available jobs termed “demand for workforce”-in the third quarter of 2013 fell by 139,000 (2.5%) from the third quarter of 2012. In 95 surveyed cities, the number of available jobs in the July-September period decreased by 232,000 (4.0%) from the second quarter of 2013.
- Erkol, O. (2013) ‘Jobless Growth is What’s Next for Turkey?’ Turkish Market News.
- Ibid. ILO (2014), p.111.
- World Bank (2012) World Development Report 2013: Jobs, Washington DC: The World Bank
- Marsh, P. (2011) ‘China noses ahead as top goods producer.’ Financial Times. 13 March.
- Ibid. Chang, G.G. (2013). See also Dobbs, R. et al. (2012) ‘The world at work: Jobs, pay, and skills for 3.5 billion people.’ McKinsey Global Institute, p.6.
- City University London( 2014) Unemployment.
- Jacobs, G. and Šlaus, I. (2011a).
- With the increase of technological innovation, many jobs require less physical and more mental work. This puts more emphasis on educational level in these new jobs, which requires different kinds of skills than manual labour. Technological innovation can also have a downside: “Technology has always been regarded as a mixed blessing. Each new advance has raised resistance from those who fear that machines will progressively eliminate the need and therefore the opportunities for gainful employment in manufacturing.” Jacobs, G. and Šlaus, I. (2011a)
- City University London (2014) Unemployment.
- World Bank (2014) World Development Indicators and Global Development Finance; See also Jacobs, G. and Šlaus, I. (2011a)
- Ibid. ILO (2014) p11. “As a result of the crisis, from 2008-2013, the global job gap, has continued to widen to a worldwide shortage of 62 million less employed than expected based on pre-crisis trends. The unemployed group of people consists of 32 million job seekers, 23 million people that became discouraged and no longer look for jobs and 7 million economically inactive people that prefer not to participate in the labour market.”
- United Nations Development Group (2013) ‘Growth and Employment in the Post-2015 Agenda: Messages from a global consultation.’ UNDG The World We Want. See also International Labour Organization (2012) ‘Global Employment Trends 2012: Preventing a deeper jobs crisis.’ ILO
- Ibid., Jacobs, G. and Šlaus, I. (2011a.)
- OECD via International Labour Organization (2012) ‘From Precarious Work to Decent Work: Outcome Document to the Workers’ Symposium on Policies and Regulations to Combat Precarious Employment.’, ILO, Bureau for Workers’ Activities.
- Evans, J. and Gibb, E. (2009) ‘Moving from Precarious Employment to Decent Work.’ International Labour Office. See also Global Union Research Network (GURN) Moving from Precarious Employment to Decent Work. GURN discussion paper no.13:5. See also Lee, S., McCann, D. and Messenger, J.C. (2007) Working Time Around the World. Trends in working hours, laws and policies in a global comparative perspective (pdf). London and New York: Routledge
- Data for 2011. International Labour Organization(2013) ‘Global Employment Trends for Youth 2013.’ Geneva: ILO, p.4.
- International Labour Organization (2014) ‘Key Indicators of the Labour Market (KILM). Summary of KILM 8th Edition.(pdf).’ILO, p.10.
- OECD (2013) ‘Better Life Index. Jobs.’ Paris: OECD. Percentage is an average for 30 OECD countries.
- International Labour Organization (2013) ‘Global Employment Trends for Youth 2013. Informal, poorly paid and unemployed: The reality of work for most youth in developing countries.’ Geneva: ILO, p.4.
- Both relative and absolute numbers of informal work have been increasing globally, but since the workforce has been increasing as well, a rise in absolute numbers only does not say much. Data from ILO (2013) ‘Global Employment Trends 2013: Recovering from a second jobs dip.’ Geneva: ILO. See also Huitfeldt, Jütting and Jütting (2009) ‘Informality and Informal Employment (pdf).’ Paris: OECD Development Centre, p.95.
- The relatively low unemployment figures in official unemployment data, which generally only include formal sector jobs, therefore do not reflect the whole picture. In Central and South-Eastern Europe and the Middle East, around 10-35% of the labour force works in the informal sector, as ILO estimates, and in Latin America and the Caribbean and in Asia and the Pacific (including South Asia), this would even be between 30 and 70%. In Africa (including North Africa), it is estimated that between 20 and 60% of the employed work in the informal sector (ILO, 2014, p.24). Even 80% of the employed have a vulnerable job in Sub-Saharan Africa and South Asia. See also Ansu & Baliamoune (2013) ‘Growing fast, transforming slowly. The case for economic transformation (presentation in pdf).’ Acet for Africa, p. 15. See also United Nations Conference on Trade and Development (2013) ‘The least developed countries report 2013. Growth with employment for inclusive and sustainable development. Overview.’ UNCTAD, p.10. See also United Nations Development Group 2013 ‘Growth and Employment in the Post-2015 Agenda: Messages from a global consultation.’ UNDG The World We Want, p.4. See also World Bank (2012) ‘World Development Report 2013: Jobs.’ The World Bank, p.5. See also International Labour Organization (2014) ‘Global Employment Trends 2014. Risk of a jobless recovery?’ Geneva: ILO, p.24.
- International Labour Organization(2013) ‘Key Indicators of the Labour Market (KILM). Summary of KILM 8th Edition (pdf).’ p.3. See also, for definition of ‘working poor’ from International Labour Organization (2013) ‘KILM 18. Poverty, income distribution, employment by economic class and working poverty (pdf).’ ILO, p.1
- Ibid., Lee, S., McCann, D. and Messenger, J.C. (2007).
- Weller, J. (2011)‘Panorama de las condiciones de trabajo en América Latina.’ Nueva Sociedad 232, marzo-abril de 2011.
- United Nations Development Group 2013 ‘Growth and Employment in the Post-2015 Agenda: Messages from a global consultation.’ UNDG The World We Want, p.4. See also Ibid., Weller, J.2011
- World Bank (2012) ‘World Development Report 2013: Jobs.’ The World Bank.
- While in Western regions, (industrial) employment was formalized in labour laws in the 20th century, in developing and emerging countries, the informal sector emerged in the late 1960s, early 70s, as a result of urbanization and the migration of farmers and countryside workers to the cities. Most of them could not get a job in the formal sector, so they turned to the informal sector. Contrary to what was expected, they were not able to improve their skills on the go and then get a formal job. In the early 1990s, in developing countries and emerging economies already half to three quarters of the jobs were informal. Despite growing formalization in the 20th century, labour markets have also become more flexible in Western regions since the 80s. Among others temporary employment increased. International Labour Organization (2012) ’From Precarious Work to Decent Work: Outcome Document to the Workers’ Symposium on Policies and Regulations to Combat Precarious Employment.’ ILO, Bureau for Workers’ Activities. See also Breman, J. (2011) ‘The Informal Sector Economy as a Global Trend (pdf).’ Women in Informal Employment: Globalizing and Organizing (WIEGO). See also Bacchetta, M., Ernst, E., and Bustamante, J. (2009) Globalization and informal jobs in developing countries. A joint study of the International Labour Office and the Secretariat of the World Trade Organization. WTO Secretariat, p.27.
- Ibid.
- Here, absolute numbers increased, but relative shares decreased from 52.4% in 2000 to an estimated 47.8% in 2013. From International Labour Organization (2014) ‘Global Employment Trends 2014. Risk of a jobless recovery?’ Geneva: ILO, p.98. . See also Kapsos, S. and Bourmpoula, E. (2013) Employment and Economic class in the Developing world (pdf). ILO Research Paper No, 6:18.
- World Bank (2012) ‘World Development Report (2013): Jobs.’ The World Bank, p.6.
- United Nations Development Group (2013) ‘Growth and Employment in the Post-2015 Agenda: Messages from a global consultation.’ UNDG The World We Want, p.4.
- Ibid.
- World Bank (2012) ‘World Development Report 2013: Jobs.’ The World Bank, p.6.
- Measured as workers that live in a poor household, using the World Bank’s threshold of earning less than US$ 2.00 per day. International Labour Organization (2013) ‘Global Employment Trends 2013: Recovering from a second jobs dip.’Geneva: ILO.
- Ibid., Kapsos, S. and Bourmpoula, E. (2013)
- Alderman, L. (2012) ‘Ranks of Working Poor Grow in Europe.’ New York Times, 2 April 2012, p.A4. Poverty in the EU is measured as 10,240 euros a year for single adult workers, as Eurostat does, and poverty in the US as US$ 10,830 a year.
- Ibid., Lee, S., McCann, D. and Messenger, J.C. (2007) p.32.